Ecosystem services are functions and products from nature that can be turned into benefits with varying degrees of human input, such as fish caught from the sea, or waste remediation processes (Natural Capital Committee, 2017).
Overview
This section provides guidance on ecosystem services that are supported by marine natural capital assets, covering:
- Guidance flowchart: ecosystem services
- What are ecosystem services?
- Classifying ecosystem services
- Useful tools: asset-service and asset-benefit matrices
- Which to use, an asset service or asset-benefit matrix?
- Asset-service linkage caveats and limitations
- Gathering data on ecosystem services
- Links to ecosystem service data
- Best practice recommendations to apply ecosystem service classifications and frameworks
Depending on resources and objectives, the assessment may apply a:
- Basic approach: High level characterisation of natural capital asset to ecosystem service links based on generic frameworks
- Better approach: As for "Basic" plus incorporation of site knowledge to support asset linkages and level of ecosystem services, including temporal or spatial trends*
- Best approach: As for "Better" plus more engagement and data gathering to provide site level assessment.**
* As an example see Isles of Scilly asset and risk register developed using the ecological knowledge of fishers (Ashley et al., 2020)
** As an example see the North Devon asset and risk register, applying workshops to gather community weighting of natural capital, ecosystem service relationship and risk of losing the service, (Rees et al., 2019)
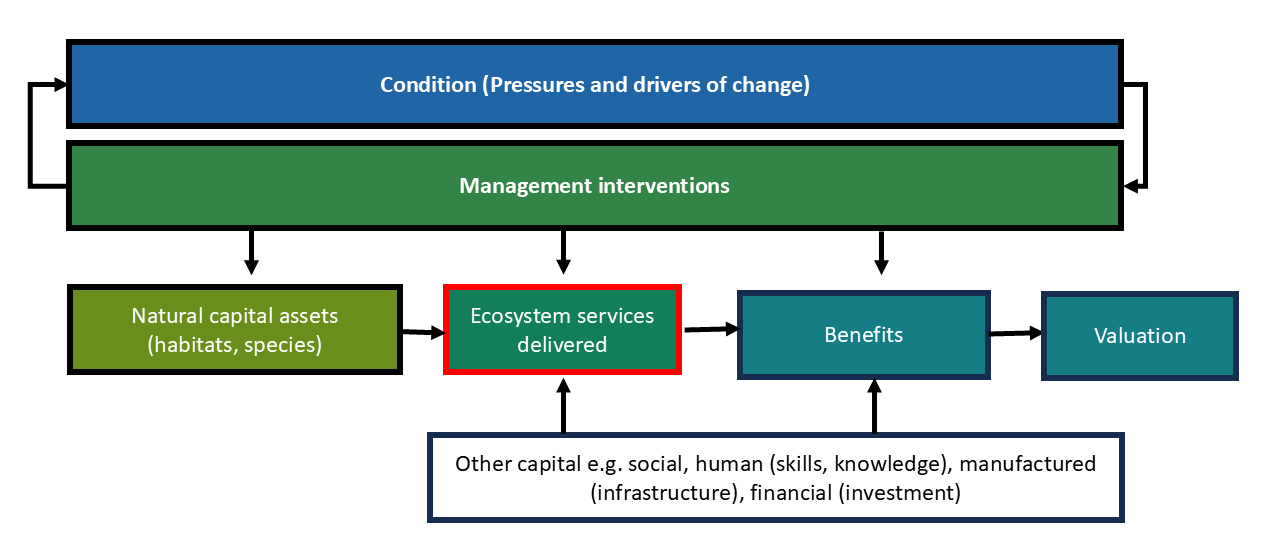 Figure 1: Natural Capital conceptual framework, the logic chain shows that ecosystem services are provided by the stocks of natural capital assets.
Components
Guidance flowchart: ecosystem services
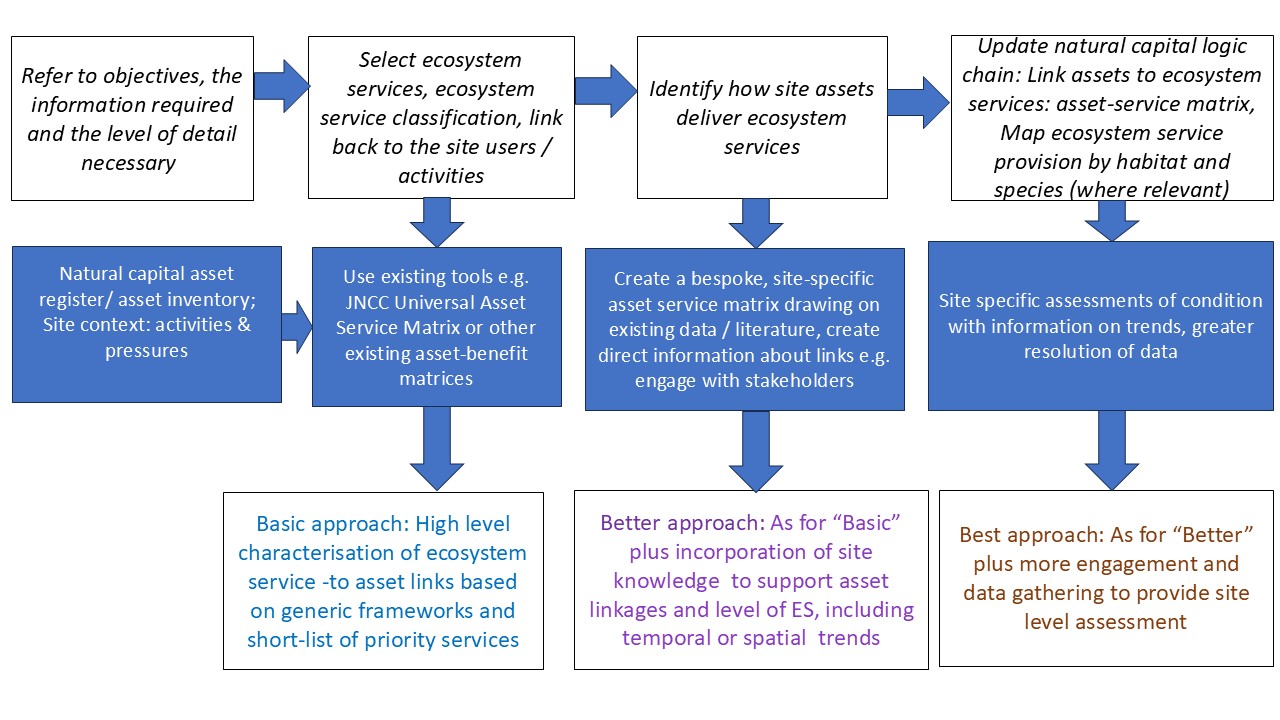 Figure 2: Steps to follow to support ecosystem service assessment for marine and coastal ecosystems
What are ecosystem services?
Ecosystem services are defined as functions and products from nature that can be turned into benefits with varying degrees of human input, such as fish caught from the sea, or improvements to water quality by biological processing or storage of wastes in sediment (Natural Capital Committee, 2017). The stocks of natural capital (assets) and the ecosystems within which they are embedded, provide flows of ecosystem services over time (see Figure 2).
Assessing the link between stocks and ecosystem services is a core component of natural capital assessments. Some services require human capital to realise benefits (e.g. fishing to get seafood) (Maes et al., 2013). Other services are free flowing, with benefits obtained passively without the need for human input (e.g. carbon sequestration), however, their use may depend on other factors influencing uptake. For example, there may be capacity held in benthic habitats to provide ‘waste remediation’ across large areas, but the supply of this ecosystem service is only prevalent where those habitats are most exposed to waste (for example in areas exposed to runoff from rivers).
Benefits are changes to human welfare that result from ecosystem services. The realisation of benefits from the flow of ecosystem services typically requires human inputs including manufactured capital (e.g. fishing vessels, port infrastructure), human capital (e.g. the time, knowledge and skills of fishers) and social capital (e.g. relationships within and between fisher communities, and their relationships with other communities). These capital inputs are not covered in this guidance, but information about beneficiaries and the value of services is covered in the valuation section.
Capacity to supply a service is held in the assets that have relevant features or functions, that are needed for that ecosystem service. For example, the capacity to supply the ecosystem service ‘disturbance prevention’ is supported by features that dissipate wave energy such as the presence of rock or vegetation (kelp, saltmarsh). Both living (biotic) assets and the non-living (abiotic) features of an area may be important in terms of determining capacity to supply a service.
Capacity will often depend on the state or condition of the asset but typically understanding this link is a current gap in knowledge. For some services, we know little about the link between where the assets supply the ecosystem service and where benefits arise, but for others we have more understanding. For example, for fishing there may be local benefits such as jobs and and income, but the broader benefits of nutrition and health from the seafood extracted could be felt much more widely, dependent on how far a particular output is distributed in the supply chain. For individual stocks of migratory species the area where the species is fished and/or landed, may be far away from important nursery and feeding grounds, creating uncertainty in the spatial link between the supporting natural capital assets and the ecosystem service.
When approaching the assessment of ecosystem services, it is important to note that:
- The concept of ecosystem services is highly anthropocentric. Ecosystem functions and / or processes (see guidance below) can only be considered services in the presence of humans to benefits from them. For example, marine habitats can provide coastal protection, but if there are no houses or businesses or other valuable pieces of land behind the coast benefiting from the coastal protection, the service of coastal protection should not be captured in a natural capital assessment.
- To avoid double counting in valuation or natural capital accounts, natural capital assessments should clearly differentiate between ecosystem services and benefits. For example, carbon sequestration is an ecosystem service and the net human benefit results from the climate control. Where possible, it is the final benefit that should be valued (although this can be challenging in practice).
Abiotic characteristics that influence ecosystem processes and functions
Abiotic characteristics influence ecosystem processes and functions either directly or indirectly through effects on natural capital assets and the processes and the functions they provide. Important characteristics include:
- Water temperature
- Water chemistry
- Sediment/substratum type
- Large-scale weather events
- Light attenuation
- Water movement (currents and waves)
Ecosystem processes and functions that underpin ecosystem services
Ecosystem functions are the processes and components associated with biota that support or provide ecosystem services (de Groot, 2002). Typical biotic components and processes, or their characteristics, that are regarded as ecological functions underpinning ecosystem services include:
- Primary production
- Secondary production/ nutrient cycling
- Larval and gamete supply
- Formation of species habitats
To support natural capital assessments and the valuation of benefits, considerable effort has been devoted to understanding how ecosystem services differ from natural capital assets (or components), ecosystem processes and functions, and benefits. The framework developed by the UK National Ecosystem Assessment (UK NEA) describes how marine ecosystem natural capital assets and processes support intermediate services (the ecological functioning of the ecosystem) and how these deliver ecosystem services and goods and benefits to people. The ecosystem cascade captures the relationship between processes and functions to benefits (Figure 3).
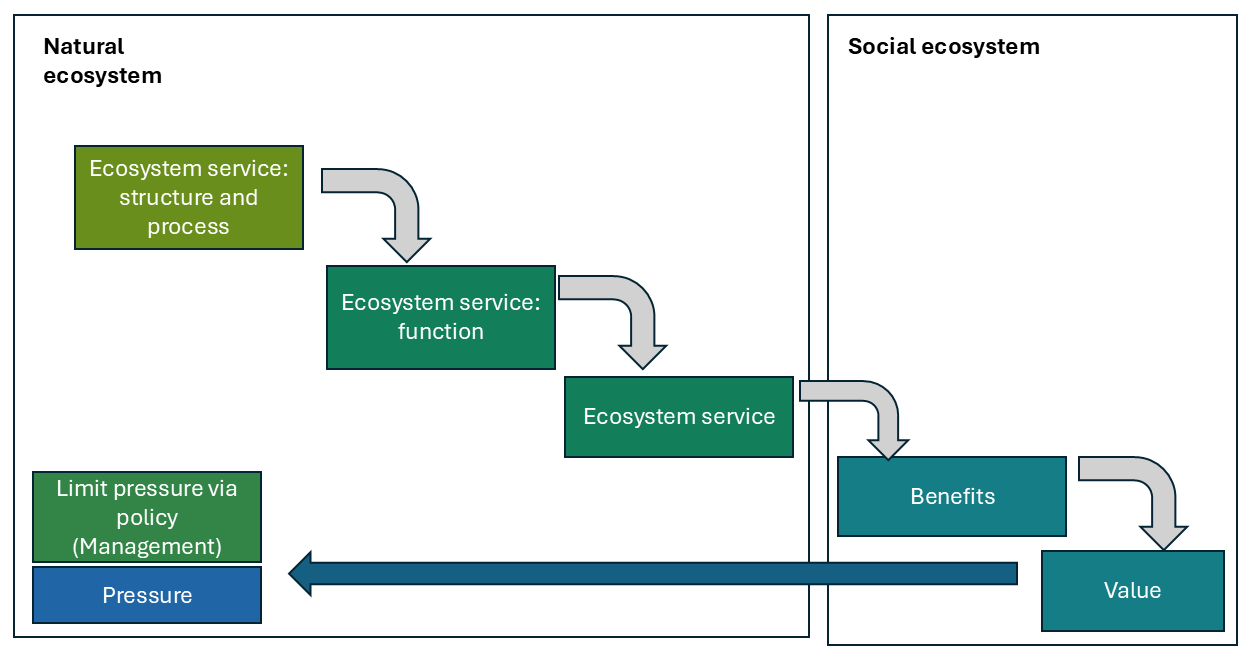 Figure 3 Ecosystem service cascade (figure redrawn following de Groot et al., 2002)
Species identity and abundance
The presence of specific species is found to be important for most services, including species-based recreation and the provision of fish, food and raw materials. Keystone species are those with a key role in maintaining particular ecosystem or ecosystem states and strongly influence the supply of ecosystem services from that particular habitat. Examples include vegetated habitats (kelp, seagrass, and saltmarsh) and biogenic habitats (bivalve reefs).
To support natural capital assessments and the valuation of benefits, considerable effort has been devoted to understanding how ecosystem services differ from natural capital assets (or components), ecosystem processes and functions, and benefits. The framework developed by the UK National Ecosystem Assessment (UK NEA) describes how marine ecosystem natural capital assets and processes support intermediate services (the ecological functioning of the ecosystem) and how these deliver ecosystem services and goods and benefits to people (Figure 3).
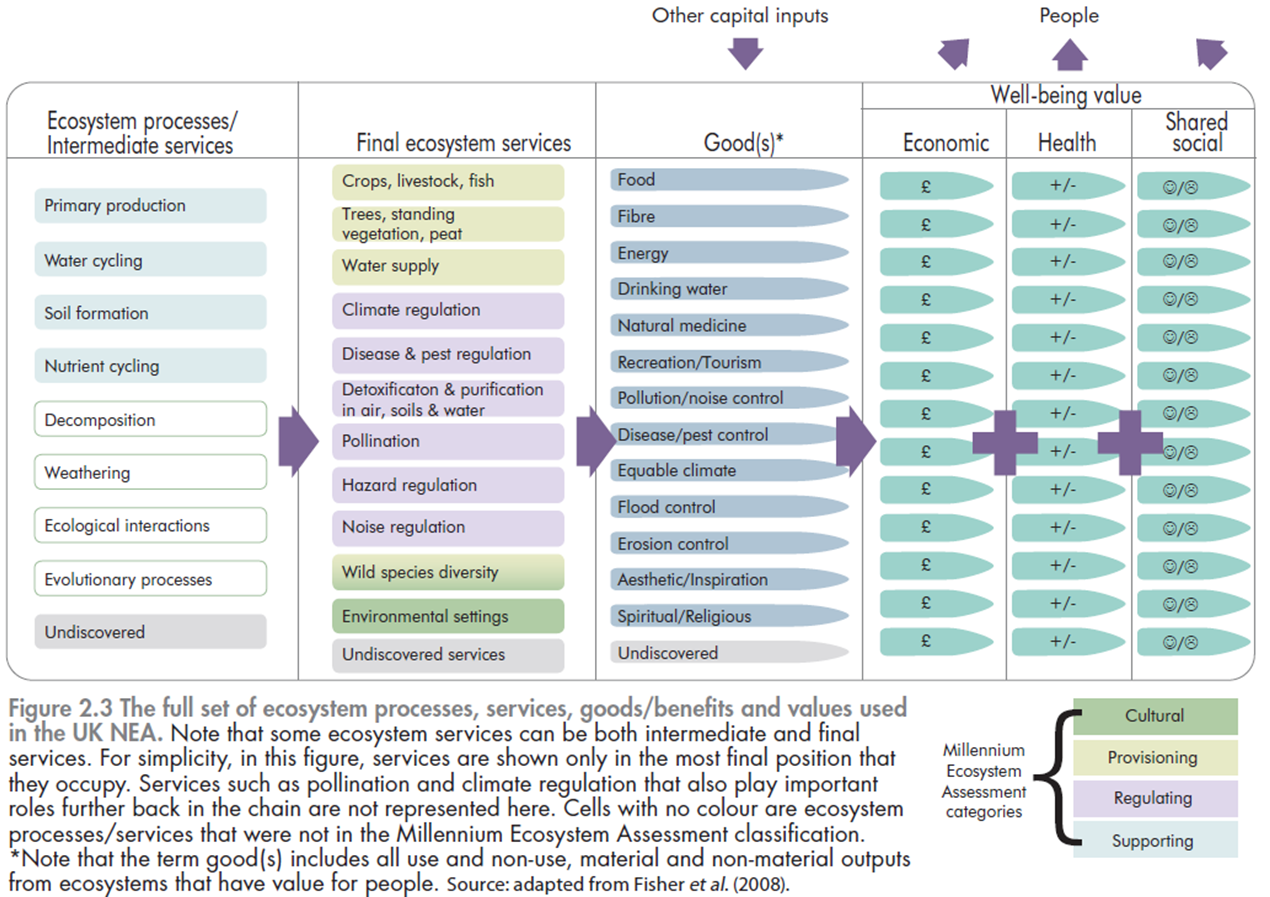 Figure 4: Ecosystem service cascade demonstrating the relationship between the natural and social ecosystem and links to pressure.
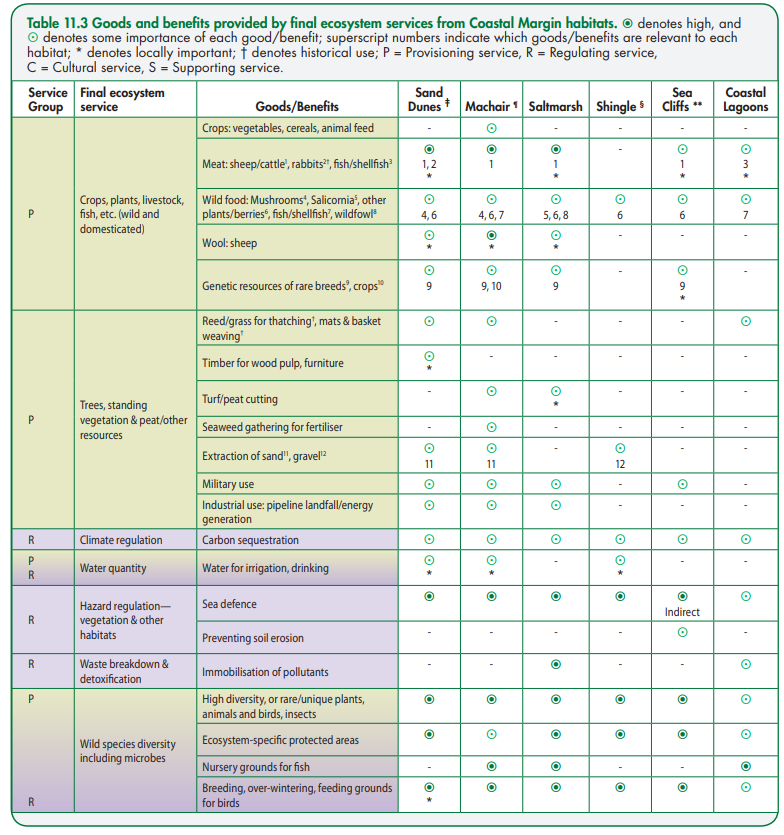 Figure 5
When approaching the assessment of ecosystem services, it is important to note that:
- The concept of ecosystem services is highly anthropocentric. Ecosystem functions and / or processes can only be considered services in the presence of humans to benefits from them. For example, marine habitats can provide coastal protection, but if there are no houses or businesses or other valuable pieces of land behind the coast benefiting from the coastal protection, the service of coastal protection should not be captured in a natural capital assessment.
- To avoid double counting in valuation or natural capital accounts, natural capital assessments should clearly differentiate between intermediate (or supporting) services, final services and benefits. For example, carbon sequestration is an ecosystem service and the net human benefit results from the climate control. Where possible, it is the final benefit that should be valued (although this can be challenging in practice).
Classifying Ecosystem Services
Following the Millennium Ecosystem Assessment (MA, 2005), ecosystem services are typically grouped into the following categories:
- Provisioning services – products obtained from ecosystems, including food, fuel, timber and medicines.
- Regulating services – obtained from the regulation of ecosystem processes, including climate regulation, waste remediation, coastal protection, air quality regulation and nursery habitats.
- Cultural services – result from cultural practices, interactions and relationships with environmental spaces. Unlike provisioning and regulating services, they are not the result of ecosystem functions and processes alone.
A number of ecosystem service classifications have been developed (e.g. through the Millennium Ecosystem Assessment, The Economics of Environment and Biodiversity and the UK NEA, among others).The following guidance section in the drop down provides more information about a widely adopted framework, the Common International Classification of Ecosystem Services (CICES).
Common International Classification of Ecosystem Services (CICES) (recommended approach)
The Common International Classification of Ecosystem Services (CICES) is the approach we recommend using as CICES is one of the most commonly used classification systems for natural capital assessments.
The CICES classification aims to support natural capital accounting and valuation and is designed to reduce double counting, by focussing only on final ecosystem services and excluding intermediate and supporting ones. The CICES classification defines ecosystem services as the contributions that ecosystems make to human well-being, with these being distinct from the goods and benefits that people subsequently derive from them (represented as the social ecosystem side of the ecosystem service cascade diagram presented above. The definition of each service identifies both the purposes or uses that people have for the different kinds of ecosystem service and the particular ecosystem attributes or behaviours that support them (Haines-Young and Potschin, 2018).
The framework includes a wide-range of ecosystem services but not all are applicable to the marine environment. Projects that have identified the marine relevant services are Culhane et al., 2019 (used CICES version 4.3) and Tillin et al. (2019, used CICES version 5.1). The Classification has now been updated and CICES v5.2. is now available (Tip: Search for CICES v5.2 to download the Excel spreadsheet).
Table 1 provides a list of CICES ecosystem services that are likely to be a high priority for basic natural capital approaches and that were considered in the case studies.
Table 1 Shortlisted ecosystem services from CICES v5.2 providing user friendly names as used in the asset-service matrices and valuation in the case studies.
| Ecosystem Service Level 2 |
Ecosystem Service Level 3 (user friendly name) |
Description/Examples |
| Provisioning |
| Food |
Cultivated seafood |
Aquaculture |
| Game and wild fish |
Capture fisheries |
| Non-food products from non-living sources |
Aggregates |
| Water |
Water supply |
Desalination |
| Energy |
Energy from non-living sources |
Wind, wave, tidal energy |
| Carrier |
Commercial and other transport |
Movement of goods via waterways, cables, military training exercises |
| Regulation and maintenance |
| Environmental quality |
Water quality |
Dilution, animals/plants that filter waste |
| Refuge habitats and nursery, breeding, and feeding grounds |
Nursery populations and habitats or breeding grounds |
Seagrass and kelp forests acting as a refuge for juvenile fish |
| |
Refuge habitats |
Ross worm reefs as a refuge for pink shrimp |
| |
Feeding grounds |
Intertidal cockle beds supporting wading birds |
| Hazard and nuisance reduction |
Erosion control |
Macroalgae and biogenic reef structures contributing to sediment stabilisation |
| Flood protection |
Macroalgae beds and biogenic reefs contributing to attenuation of wave energy and flood prevention |
| Climate regulation |
Environmental regulation |
Sequestration of carbon |
Useful tools: asset-service and asset-benefit matrices
Asset Service Matrices (ASMs) catalogue and describe known linkages between natural capital assets (habitats and species) and their associated ecosystem services. They also provide a visual summary of these linkages which can help make the information easier to digest. Typically, asset-service matrices provide some indication of the level of service flowing from the asset (e.g. none, low, medium, high) and the confidence in the link. (Tip: These matrices provide a useful starting point to understand how natural cpaital assets may be supporting ecosystem services, they can be used for the basic approach, or as a starting point for better and best approaches).
A wide range of previous studies have developed or reviewed ecosystem service typologies and classifications. Key studies are not reviewed in detail here but the examples provided below include descriptive studies identifying ecosystem services and linkages to ecosystem components that provide these:
- Alexander et al. (2016) identified components of marine ecosystems critical to ecosystem service generation;
- Beaumont et al. (2007 and 2008) linked marine biodiversity to ecosystem services;
- Culhane et al., (2018 and 2019) linked marine ecosystems and specific components with ES;
- Fletcher et al. (2012) linked ecosystem services provided by MPAs linked to broad-scale habitats and features of conservation importance;
Common approaches to link natural capital assets to ecosystem services, include the development of asset-service matrices. Examples of these include:
- Key UK breeding seabird species and their relative contribution to the delivery of intermediate ES and goods/benefits (Burdon et al., 2017);
- European Diadromous fish linked to CICES class types using a matrix from combined evidence review and expert elicitation (Ashley et al., 2023)
- The relative degree of ES provision from habitats and species within UK Marine Protected Areas (MPAs) (Potts et al., 2014);
- JNCC Universal Asset Service matrix (uASm) that links ecosystem services to the assets (habitats and species) that produce them (Cordingley et al. 2023). This is a key resource, see information below!
- UK NEA 2011 Asset to benefit matrices rather than asset service.
Ecosystem service matrices can be used to generate diagrams which graphically represent connectivity between the ecosystem and the services it supplies, as well as the strength of the connections. These may be simple, such as Figure 2 or more complex such as the linkage diagrams (Sankey diagrams) used to support the assessment of the impacts of gradual habitat degradation on the availability of corresponding ecosystem services by Armoškaite et al., 2020.
Note: The level of certainty associated with such asset-service and asset benefit linkages depends on the underlying information used to construct the links.
The JNCC Universal Asset Service Matrix
JNCC has developed a Universal Asset Service Matrix (uASM) tool. This aims to make evidence for natural capital assets and their ecosystem services more accessible and available to a wider audience.
This tool stores data from existing ASMs and the wider literature in a standardised format. The standardisation within the uASM allows users to export data into any commonly used habitat or ES classification and enables the creation of bespoke ASMs for specific contexts.
The uASM currently contains over 4,000 documented asset-ecosystem service linkages and continues to grow, demonstrating the wide range of ES delivered by UK marine habitats and coastal saltmarsh. Users can filter by natural asset or by ES and can choose to what resolution they conduct this. Further filters include ES supply level (a relative score to gauge to what degree the ES is being supplied) and confidence scores (confidence in the link – ranked high, medium or low depending on data source). Each link comes with a reference and so can be easily traced back to the resource it was extracted from.
Table: Habitat asset-service matrix example showing some habitats from the Cornwall case study. The source for these assessments is the JNCC uASM
| Habitat |
Wild Seafood |
Water quality |
Erosion control |
Coastal protection |
Climate regulation (carbon sequestration) |
Wildlife watching |
Aesthetics |
| A3.1 - High energy infralittoral rock |
High |
Med |
|
High |
Med |
High |
Low |
| A3.2 - Moderate energy infralittoral rock |
High |
Med |
|
High |
Med |
|
Low |
| A5.6 - Sublittoral biogenic reefs |
High |
Med |
Med |
High |
Med |
|
Low |
Project examples
UK National Ecosystem Approach (UK NEA)
An alternative approach to the JNCC uASM draws on the outputs of the UK NEA. The NEA assessed a suite of ecosystem benefits and services. Simple matrices assess the importance of coastal and marine habitats to different ecosystem goods and benefits on a scale of no, some or high importance. It symbolically indicates whether the contribution is locally important or represents historical use.
The assessments represent six coastal margin habitats (Sand Dunes, Machair, Saltmarsh, Shingle, Sea Cliffs and Coastal Lagoons) and the marine environment as a whole. The key distinction between the NEA approach and the JNCC universal matrix is that the NEA approach primarily links habitat assets to ecosystem benefits, rather than ecosystem services.
Marine Protected Area features
A literature review by Fletcher et al. (2012) delivered a baseline understanding of the marine ecosystem services provided by the broad scale habitats and features of conservation importance that were likely to be protected by Marine Conservation Zones (MCZs). Each feature was reviewed to identify the beneficial ecosystem processes and ecosystem services using a systematic search method. This approach was extended and elaborated by Potts et al. (2014) to include features from other marine protected area (MPA) designations. They used a five-point scale to assess contribution and assigned three confidence levels (Table 5). The marine matrix was developed by Potts et al. in (2014) and reapplied in several different marine settings in the UK alone or in combination with final services from CICES.
The Potts et al. (2014) classification identifies: supporting services, regulating services, final ES and goods and benefits as shown below in Table 1 and the example matrix.
Table 1 Ecosystem services assessed by Potts and others (2014)
| Supporting services |
Regulating services |
Goods and benefits from provisioning services |
Goods and Benefits from Regulating services |
Goods and Benefits from Cultural services |
Primary production
Larval / Gamete supply
Nutrient cycling
Water cycling
Formation of species habitat
Formation of physical barriers
Formation of seascape |
Biological control
Natural hazard regulation
Regulation of water and sediment quality
Carbon sequestration |
Food
Fish feed
Fertiliser
Ornaments (incl. aquaria)
Medicine and blue biotechnology |
Healthy climate
Prevention of coastal erosion
Sea defence
Clean water and sediments
Imobilisation of pollutants |
Tourism / Nature watching
Spiritual / Cultural wellbeing
Aesthetic benefits
Education |
Which to use, an asset-service or asset-benefit matrix?
While deciding whether to use an asset-service or asset-benefit matrix may seem an academic discussion, it has implications for natural capital assessments.
Asset-benefit matrices have the advantage that they more readily facilitate valuation (because benefits are the focus of valuation). Many of the benefits identified by the NEA and used by Potts and colleagues have been valued and are captured in the ONS marine natural capital accounts. They also lend themselves to further, more refined valuation. For example, Burdon et al. (2024) have developed a model (the BEACH tool) to disaggregate national level economic values from marine natural capital accounts according to the relative importance of EUNIS habitats in providing those benefits which are valued. Nevertheless, asset-benefit matrices are disadvantaged by a lack of a comprehensive benefit classification, especially in relation to cultural benefits. What is captured in the matrix may be a limited representation of the full suite of benefits. Where studies can only access indicators for limited ES and benefits then assessment is best viewed as an underestimate of the full suite of benefits.
A limitation of matrix approaches are that these does not take into account the condition of habitats and therefore assumes that one habitat type (e.g. saltmarsh) provides the same amount of services or benefit as another patch of the same habitat type elsewhere in the UK. In many cases the condition/service relationship data doesn’t currently exist and research in this area is on-going.
In addition, given the level of uncertainty in the linkages between assets and services, and services and benefits, removing services from the logic chain is likely to increase the uncertainty in the overall natural capital assessment.
The link between asset condition and benefit is not well established. A change in benefits derived from natural capital assets may simply reflect a change in human preferences, rather than the result of ecosystem change.
Asset- service linkage caveats and limitations
Ecosystem service classifications provide a strong conceptual basis for assessing ecosystem services but are usually modified to suit specific project requirements. Modifications include focusing on a subset of services, grouping others and applying project specific definitions.
The certainty in asset-service links is highly variable. In some cases the links are clearly demonstrated, for example, stocks of commercially targeted fish supply food. In other instances, the links are less tangible or are more likely to be highly variable, for example the link between marine habitats and blue carbon sequestration or how natural capital assets contribute to cultural benefits such as education and research. Cultural services can be particularly challenging to assess as they are highly reliant on place and situation. Understanding from one location can be difficult to transfer to different places, or upscale and confidence in indicator data needs to be acknowledged at all times.
Users should be aware that the classifications based on habitats typically do not relate ecosystem service provision to the components of natural capital that directly support the service. For example, while saltmarsh or mudflats provide erosion prevention,this does not recognise that it is the plants, tubes of invertebrates and films of tiny algae and microorganisms that supply the service. Many assessments also rely on generic asset service linkages (with all examples of a given habitat being considered in the same way, irrespective of the condition or extent of the habitat).
For most users, using habitats as the units that provide ecosystem is likely to be adequate, but the limitations of this generic approach should be recognised. It has implications when trying to understand how the service is supplied, how the service may be altered by pressures from human activity, and how to protect or restore the service. How specific species support ecosystem service delivery is an active area of research with the evidence base being developed. However, most evidence for specific components will be scattered through the scientific literature and will not be readily accessible.
Gathering data on ecosystem services
Other forms of gathering information on ecosystem services flow are to adopt the approaches described in the valuation section that involve stakeholders. Examples of these approaches for the marine environment are participatory mapping approaches (Burdon et al., 2022) and the community voice method (Ranger et al., 2016) trialled in Orkney (as one example).
An example of a full review of all data sources identified for UK sites covered by Natural Capital Asset and Risk Registers (against MMO criteria for indicators robustness, scalability, transparency, etc) is the State of the Sound report (Rees et al., 2023). Local workshops are useful to make sure site specific data can be added to the list in the table. For the Plymouth based State of the Sound report, a workshop was held with local experts and interest groups including DEFRA family area teams (MMO, NE, EA) to identify relevant indicators and data sets
See the stakeholder engagement section or more information on how to identify and map stakeholders able to provide information on ecosystem services. Where there are opportunities to collect this information, gathering evidence for the natural capital logic chain would provide context for the natural capital assessment.
Note: This guidance is linked to a spatial data tool which can be searched and added to and you can also generate and then download the data sources it contains. See the guidance and background here.
Project Examples
Stakeholder engagement example: Linking natural capital, benefits and beneficiaries-The role of participatory mapping and logic chains for community engagement
The approach uses a novel stakeholder driven approach to participatory mapping which enables communities in natural capital discussions across a series of face-to-face workshops. The approach has been applied in Deben Estuary, Suffolk (UK), and more recently in the Cromarty Firth and Solent; however, the methodological framework could be applied to any global ecosystem (terrestrial, freshwater, estuarine, marine, urban) and community setting.
From a management perspective, the outcomes of this approach can help to identify which benefits, and therefore which beneficiaries, may be impacted by an intervention, and what direction that impact may take.
Burdon, D., Potts, T., Barnard, S., Boyes, S.J. and Lannin, A., 2022. Linking natural capital, benefits and beneficiaries: The role of participatory mapping and logic chains for community engagement. Environmental Science & Policy, 134, pp.85-99.
Scottish Wildlife Trust: Oceans of Value
The Trust’s Oceans of Value project set out to compare two different approaches to identifying key values associated with the marine environment: a natural capital approach and the Community Voice Method. Work focused on the seas surrounding the Orkney Islands (out to 12 nautical miles from Orkney’s coastline), which is one of the most well-studied marine environments in Scotland.
To capture the different values (derived from ecosystem services) members of Orkney’s community place on the marine environment, a range of stakeholders were interviewed using Community Voice Method.
Further examples: The North Devon Marine Pioneer
The North Devon Marine Pioneer also approached firstly linking stakeholders/beneficiaries to natural capital assets, and secondly gathering local community perception of the importance of natural capital asset - benefit relationships and the risk (from existing pressures) to those relationships:
Report One linked stakeholders or beneficiaries to natural capital assets for ‘wild food’ benefits and for recreation and tourism benefits). (links between natural capital in North Devon and the stakeholders linked to fisheries) (stakeholders related to activities and businesses associated with watersports and coastal recreation) pp30-35
Ashley, M., Rees, S.E., Cameron, A. 2018. North Devon Marine Pioneer Part 1: State of the art report of the links between ecosystem and ecosystem services in the North Devon Marine Pioneer. A report to WWF-UK by research staff the Marine Institute at Plymouth University.
Report Two used a workshop setting to integrate a metric for Community Based Knowledge of the Risk developed though participation in a workshop of the members of the North Devon Marine Working Group (MWG). (Importance of the asset - benefit relationship was first scored low, moderate or high and risk to the asset - benefit relationship was assessed between low - medium - high).
Rees, S.E., Ashley, M., Cameron, A. 2019. North Devon Marine Pioneer 2: A Natural Capital Asset and Risk Register. A SWEEP/WWF-UK report by research staff the Marine Institute at the University of Plymouth
Links to ecosystem service data
In this section we give examples of the types of data that are available to try and understand the capacity to supply ecosystem services (ES) and the flow of ES. These are shown below in Table 4 and are taken from a range of sources (expert reviewers, Burdon, 2020; Hattam et al. 2015; Lear et al., 2021, Wigley et al., 2020).
Note: This guidance is linked to a spatial data tool which can be searched and added to and you can also generate and then download the data sources it contains. See the guidance and background here.
Table: Ecosystem service provision and capacity
| Ecosystem service |
Data type |
Source |
| Provisioning: Wild seafood, fish and shellfish |
ES flow: Fisheries landing statistics. |
Internet search for up to date government and MMO fisheries statistics. The regional Inshore Fisheries and Conservation Authorities (IFCA) provide a wide range of assessments and data. Search for your regional IFCA. Each IFCA have their own reports on crab and lobster and many other species, eg mussel. Examples are provided below:
UK Landings 2023:
Monthly Sea Fishery Statistics
MMO sea fishery statistics
Declared catches report on salmon, sea trout, eels, smelt and lamprey
International Council for the Exploration of the Sea provide assessments of stock spawning biomass and total allowable catch assessments for ICES areas as well as many other datasets and a wide range of information.
Cefas provide a wide range of data including stock assessments, the data portal can be searched by species or data type species
|
| Provisioning: Wild seafood, fish and shellfish |
Capacity to supply ES: Presence/absence of desirable species; diversity of desirable species: Stock: area (m2) or biomass (tonnes km2) of seaweed.
UK Capacity indicators: Reproductive capacity of commercially exploited stocks of UK interest. |
Marine Online Assessment Tool for UK Indicators |
| Provisioning: Wild seafood, fish and shellfish |
ES flow: Vessel Monitoring System (VMS) combined with UK commercial landings records (UK vessels >12m able to be evaluated at reasonably high spatial resolution). Supports mapping. |
Vessel monitoring system data is not publicly available, contact the MMO for enquiries. Some aggregated and anonymised data may be available, for example, the 2020-2022 dataset |
| Provisioning: Reared animals for nutrition, materials or energy (Cultivated seafood) |
Aquaculture |
Local site maps, licensing applications, Cefas data portal contains maps and layers |
| Provisioning: Non-food products from non-living sources |
ES flow: Aggregate production. |
Crown Estate Licensing Aggregate site agreements |
| Provisioning: Non-food products from non-living sources |
ES flow: Salt production. |
Crown Estate Licensing. |
| Provisioning: Energy from non-living sources |
Wind, wave and tidal energy. |
The Crown Estate Open Data |
| Provisioning: Water supply |
ES flow: Water abstraction. |
Water available for abstraction (largely relevant to rivers and catchments) |
| Regulation: Water quality |
ES capacity to supply: |
Environment Agency Water Quality Data, Clean Seas Environmental Monitoring Programme; CEFAS Data hub; Blue Flag Beach Quality |
| Regulation: Water quality |
ES capacity to supply: Presence of filter feeders. Presence of macroalgal beds. |
Use habitat (asset maps), see Natural Capital Assets for data for kelp beds, mussel beds, oyster. |
| Regulation: Erosion control |
ES capacity to supply: Sediment stabilisation/ spatial configuration. Width/area/location for dynamic movement & development of coastal habitats, e.g. saltmarsh and sand dune. |
Environment Agency datalayers for: saltmarsh extent and zonation. |
| Regulation: Erosion control |
ES capacity to supply: Extent (km2) and health of seagrass/saltmarsh/oyster bed/biogenic reefs: density of living organisms, measures of growth and production, optimum ecophysiology. |
Use habitat (asset maps),
Centre of Ecology and Hydrology Land Cover Map: https://www.ceh.ac.uk/data/ukceh-land-cover-maps |
| Regulation: Flood protection |
ES flow: Reduced inundation of terrestrial areas from marine flooding. |
Environment Agency: Risk of Flooding from Rivers and Sea |
| Regulation: Flood protection |
Reduced inundation of terrestrial areas from marine flooding. |
AIMS Spatial Flood Defences. The Environment Agency’s Spatial Flood defences layer is a national comprehensive layer which shows flood defences currently owned, managed and inspected by the EA. |
| Regulation: Flood protection |
Reduced inundation of terrestrial areas from marine flooding. |
National Coastal Erosion Risk Map
Shoreline Management Plans |
| Regulation: Refuge habitats and nursery, breeding, and feeding grounds |
Number and diversity of species using the area for nursery or reproduction (Hattam et al., 2015).
Area of habitat or density of biogenic habitat creating species “used” or identified as important for nursery or reproduction (Hattam et al., 2015).
Production and maintenance of complex structure providing suitable habitat including shelter from predators.
Provision of food resources. |
No national datasets identified, consider using complex biogenic habitats, seagrass, saltmarsh, kelp as proxies. |
| Regulation: Climate regulation (carbon sequestration) |
Carbon sequestered and greenhouse gases fixed. |
No base maps for carbon storage use habitat asset maps as a proxy. See also Wildlife Trust commissioned work and estimates |
| Cultural: aesthetics |
Number and/or area of marine features of given stated appreciation; Length of Heritage Coast (km). |
Office for National Statistics; Economic and Social Data Service (ESDS) (Burdon, 2020)
Defra MAGIC MAP holds paths and routes
|
| Cultural: recreation and tourism |
Employees Working in Sector. |
Dedicated social science surveys could be conducted to develop fuller understanding of the benefits of cultural services, and links to asset condition, at both a place-based scale and national level surveys. |
| Cultural: recreation and tourism |
Seaspace available for recreation. |
Number of km2 of sea with safe water quality available for recreational use (Hattam et al., 2015). |
| Cultural: recreation and tourism |
Number and quality of beaches. |
Number and quality of beaches. |
| Cultural: recreation and tourism |
Number of visits, Duration of visits, Range of activities undertaken (number of people carrying out each activity, frequency, time spent). |
Natural England's 'Monitor of Engagement with the Natural Environment' (MENE) survey data (NERR076). Now People and Nature survey
Social media. A rang eof studies have used social media to assess cultural values. For example, back-end social media data was used to identify environmental and heritage areas of importance on St Helena, using a quick and easily transferable methodology
|
| Cultural: recreation and tourism |
Number of participants (number per year); Number of facilities (number visitors per facility/year); Amount of time spent participating (hours/days). |
Office for National Statistics; UK Centre for Economic & Environmental Development (CEED); Great Britain Tourism Survey; OBIS SEAMAP; RSPB statistics; Royal Yachting Association (Burdon, 2020)
National Cycle Network
England Coast Path:
Visit England tourism and leisure day visits https://gbdayvisitslightengland.kantar.com/ViewTable.aspx
|
| Cultural heritage |
The number of heritage assets (Burdon (2020). |
Defra MAGIC Map |
| Carrier: supply |
Ports and harbours, vessel movements. |
Slipways & boat launches http://www.boatlaunch.co.uk/ |
Best practice recommendations to apply ecosystem service classifications and frameworks
- Clearly identify links between natural capital assets and ecosystem service provision – this should also factor in the impact of asset condition into ecosystem service provision where possible (see Condition section).
- Use well-defined and replicable classification systems for ecosystem services. For example, CICES v5.2 (recommended) or the UK NEA Follow on classification.
- For basic approaches, the JNCC Universal Asset Service matrix is likely to be adequate, or at least provide a useful starting point. Users can easily explore and export the data into their preferred habitat or ecosystem service classification systems and can create their own context specific, bespoke ASMs.
References
Alexander, D., Rengstorf, A., Wellard, K., de Ros Moliner, A. and Fletcher, S. 2016. Defining the Components of Marine Ecosystems Critical to Ecosystem Service Generation. Marine Ecological Surveys Ltd – a report for the Joint Nature Conservation Committee. JNCC Report No. 594. JNCC, Peterborough.
Armoškaitė, A., Puriņa, I., Aigars, J., Strāķe, S., Pakalniete, K., Frederiksen, P., Schrøder, L. and Hansen, H.S., 2020. Establishing the links between marine ecosystem components, functions and services: An ecosystem service assessment tool. Ocean & Coastal Management, 193, p.105229.
Ashley, M., Murillas, A., Muench, A., Marta-Pedroso, C., Rodwell, L., Rees, S., Rendle, E., Bašić, T., Copp, G.H., Díaz, E. and Nachón, D.J., 2023. An evidence base of ecosystems services provided by diadromous fish in the European Atlantic Area. Ecosystem Services, 64, p.101559.
Ashley, M., Rees, S., Mullier, T., Reed, B., Cartwright, A., Holmes, L., Sheehan, E., 2020. Isles of Scilly Natural Capital Asset and Risk Register to Inform Management of Isles of Scilly Fisheries Resources. A report by research staff the Marine Institute at the University of Plymouth
Beaumont N.J., Austen M.C., Mangi S.C., Townsend M. 2008. Economic valuation for the conservation of marine biodiversity. Marine Pollution Bulletin vol 56 (3) pp 386-396
Beaumont, N.J., Aust en, M.C., Atkins, J.P., Burdon, D., Degraer, S., Dentinho, T.P., Derous, S., Holm, P., Horton, T., van Ierland, E., Marboe, A.H., Starkey, D.J., Townsend, M., Zarzycki, T., 2007. Identification, definition and quantification of goods and services provided by marine biodiversity: implications for the ecosystem approach. Marine Pollution Bulletin 54, 253–265.
Burdon, D., Potts, T., Barbone, C. and Mander, L., 2017. The matrix revisited: A bird's-eye view of marine ecosystem service provision. Marine Policy, 77, pp.78-89.
Burdon, D., 2020. Review of marine cultural, social and heritage indicators. Report to Defra by Daryl Burdon Ltd., Willerby, UK (Report No. DB Ltd. 005/2019).
Burdon, D., Potts, T., Barnard, S., Boyes, S.J. and Lannin, A., 2022. Linking natural capital, benefits and beneficiaries: The role of participatory mapping and logic chains for community engagement. Environmental Science & Policy, 134, pp.85-99.
Burdon, D., Barnard, S., Strong, J.A. & Atkins, J.P., 2024. Linking marine habitats and economic values: A spatial scaling methodology for valuing societal benefits. Ecological Economics, 224 (2024) 108316.
Cordingley A., Anderson L., Matthews S., Beach M., Molloy L., Whittaker L., Van Rein H., McNulty J., Reeve N., Parsons J. & Morgan V., 2023. The universal Asset Service Matrix (uASM). electronic dataset. Marine Life Information Network. Plymouth: Marine Biological Association of the United Kingdom. Joint Nature Conservation Committee. [April 2023] Available from https://www.marlin.ac.uk/asm
Culhane, F., Frid, C., Royo Gelabert, E., White, L. and Robinson, L., 2018. Linkage matrix of marine ecosystem services and ecosystem components, Version 1.0.
Culhane, F., Frid, C., Royo Gelabert, E., and Robinson, L. 2019. EU policy-based assessment of the capacity of marine ecosystems to supply ecosystem services, ETC/ICM Technical Report 2/2019, Magdeburg: European Topic Centre on Inland, Coastal and Marine waters Ecosystem Services
de Groot, R.S., Wilson, M.A. and Boumans, R.M., 2002. A typology for the classification, description and valuation of ecosystem functions, goods and services. Ecological economics, 41(3), pp.393-408.
Fisher, B. and Turner, R.K., 2008. Ecosystem services: classification for valuation. Biological conservation, 141(5), pp.1167-1169.
Fletcher, S., Saunders, J., Herbert, R., Roberts, C., & Dawson, K. 2012. Description of the ecosystem services provided by broad-scale habitats and features of conservation importance that are likely to be protected by marine protected areas in the marine conservation zone project area. Natural England Commissioned Reports, Number 088.
Haines-Young, R., & Potschin, M. 2018. Common international classification of ecosystem services (CICES) V5.1 guidance on the application of the revised structure. Fabis consulting ltd Retrieved from www.cices.eu
Haines-Young, R. 2023. Common Interna3onal Classifica3on of Ecosystem Services (CICES) V5.2 and Guidance on the Applica3on of the Revised Structure. [Available from www.cices.eu and https://cices.eu/content/uploads/sites/8/2023/08/CICES_V5.2_Guidance_24072023.pdf
Hattam, C., Atkins, J.P., Beaumont, N., Borger, T., Böhnke-Henrichs, A., Burdon, D., De Groot, R., Hoefnagel, E., Nunes, P., Piwowarczyk, J., Sergio, S. & Austen, M., 2015. Marine ecosystem services: linking indicators to their classification. Ecological Indicators, 49, pp. 61–75. https://doi.org/10.1016/j.ecolind.2014.09.026
Maes, J., Teller, A., Erhard, M., Liquete, C., Braat, L., Berry, P. et al., 2013. Mapping and assessment of ecosystems and their services. An analytical framework for ecosystem assessments under action 5 of the EU biodiversity strategy to 2020. Luxembourg: Publications office of the European Union
MMO 2022. Embedding a natural capital approach into marine plan development: a pilot study, MMO Project No: 1288, Month 2022, XXpp
Mulholland, R., Le Quesne, W, and Mynott, F. 2021. Rapid review of marine natural capital asset classes and logic chains to identify priority information gaps. Cefas Project Report for Defra. https://randd.defra.gov.uk/ProjectDetails?ProjectId=21142
Natural Capital Committee. 2017. How to do it: a natural capital workbook. Department for Environment Food and Rural Affairs. 30pp. https://assets.publishing.service.gov.uk/media/6017ebe2e90e07128a353a72/ncc-natural-capital-workbook.pdf
Potts, T., Burdon, D., Jackson, E., Atkins, J., Saunders, J., Hastings, E., & Langmead, O. 2014. Do marine protected areas deliver flows of ecosystem services to support human welfare? Marine Policy, 44, 139–148. Retrieved from http://www.sciencedirect.com/science/arti
Ranger, S., Kenter, J. O., Bryce, R., Cumming, G., Dapling, T., Lawes, E., & Richardson, P. B. (2016). Forming shared values in conservation management: An interpretive-deliberative-democratic approach to including community voices. Ecosystem Services, 21(B), 344-357. https://doi.org/10.1016/j.ecoser.2016.09.016
Rees, S.E., Ashley, M., Beaumont, K., Mullier, T. 2023. State of the Sound, Final Report - Using Natural Capital and Ecosystem Service Indicators to demonstrate the quality and quantity of natural assets in Plymouth Sound National Marine Park and the social and economic benefits provided to society. A report to Plymouth City Council by research staff at the University of Plymouth. Pp 41
Rees, S.E., Ashley, M., Cameron, A. 2019. North Devon Marine Pioneer 2: A Natural Capital Asset and Risk Register. A SWEEP/WWF-UK report by research staff the Marine Institute at the University of Plymouth
Tillin, H. M., 2023. Relationship between asset condition and ecosystem service delivery: Bridging the gap between the Foundational Evidence and GES projects. Defra mNCEA Report prepared for Natural England.
Tillin, H.M., Langmead, O., Hodgson, B., Luff, A, Rees, S., Hooper, T. & Frost, M. 2019. Feasibility study for a Marine Natural Capital Asset Index for Scotland. Scottish Natural Heritage Research Report No. 1071
Tillin, H.M., Langmead, O., Pegg, S., Carr, S., Gibson- Hall, E., La Bianca, G., Luff, A., Keen, P.W., Wilding, C., Nicholson, J.C., Ivory, P. & van Rein, H. 2020. Development of JNCC Marine Ecosystem Services Optimisation models. JNCC Report No. 650. JNCC, Peterborough, ISSN 0963-8091.
UK National Ecosystem Assessment. 2014. The UK National Ecosystem Assessment: Synthesis of the key findings ( S. Albon, K. Turner, and R. Watson, Eds.). UNEP-WCMC, p. 100.
UK National Ecosystem Assessment. 2011. The UK National Ecosystem Assessment technical report. Cambridge: UNEP-WCMC.Wigley, S., Paling, N., Rice, P., Lord, A., and Lusardi, J. 2021. National Natural Capital Atlas, Natural England Commissioned Report Number 285. Second edition. Natural England.
Wigley, L.R. S., Lord, A., Lusardi, J., and Rice, P. 2021. Natural Capital Atlases: Mapping Indicators for County and City Regions, Natural England Commissioned Report Number 318. Second edition. Natural England.